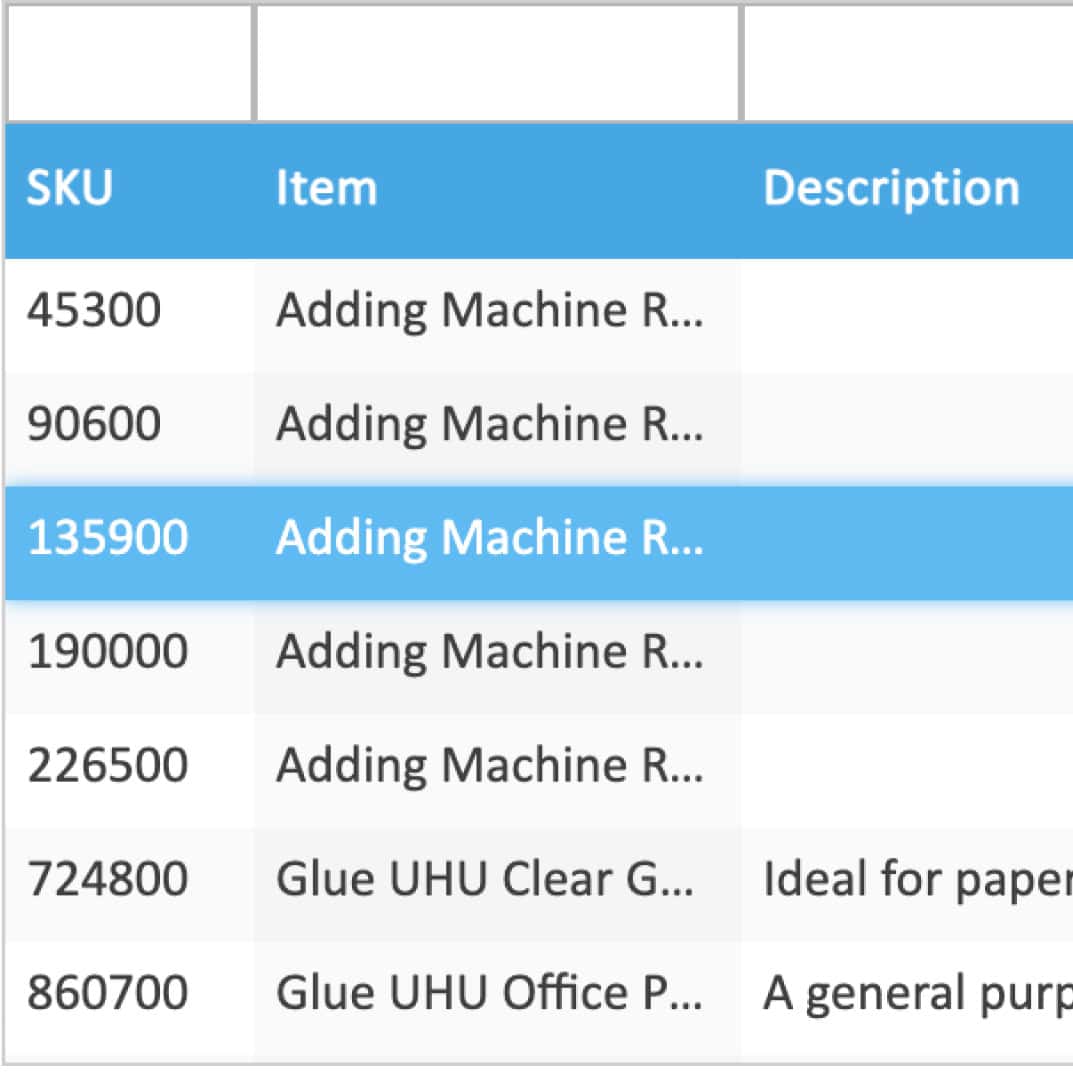
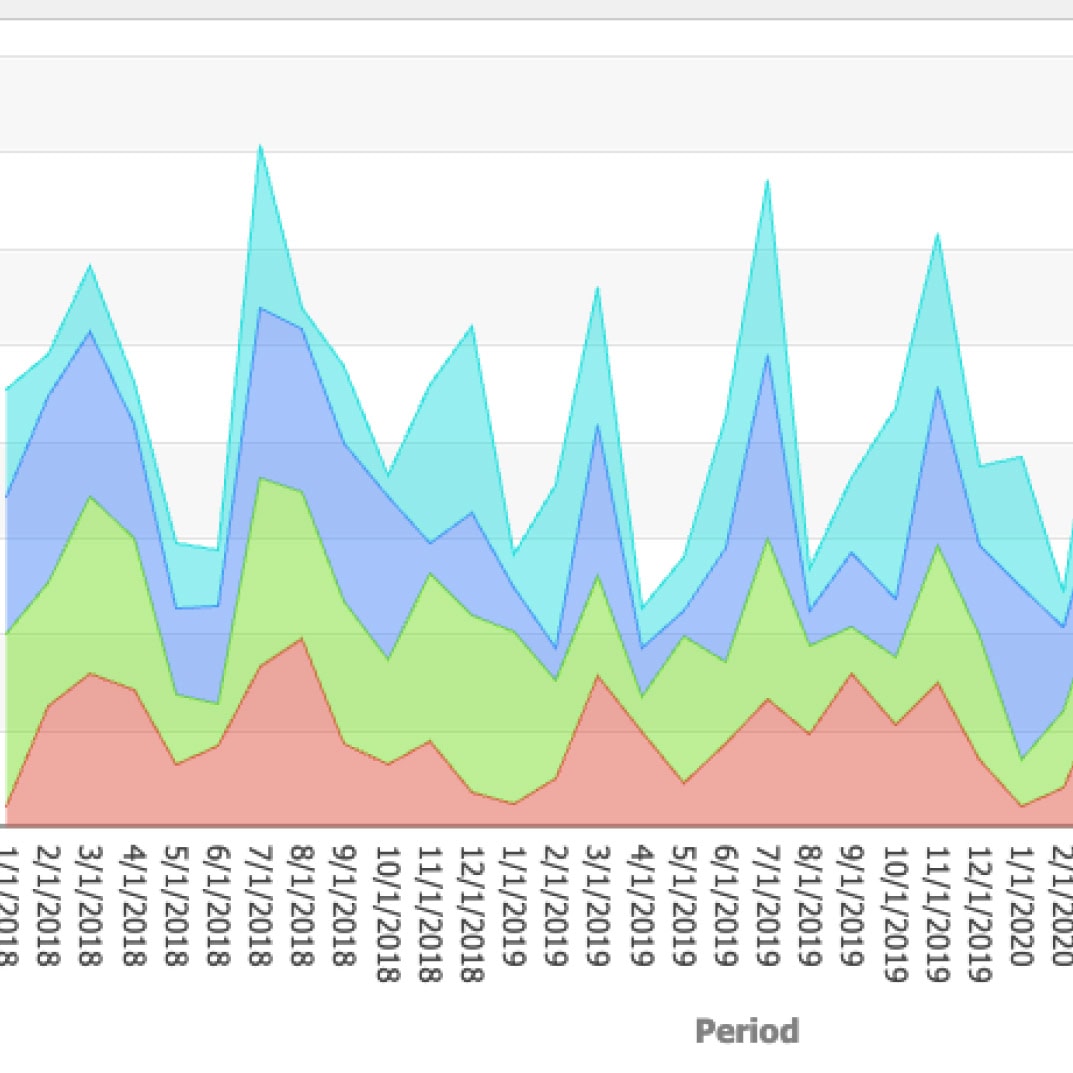
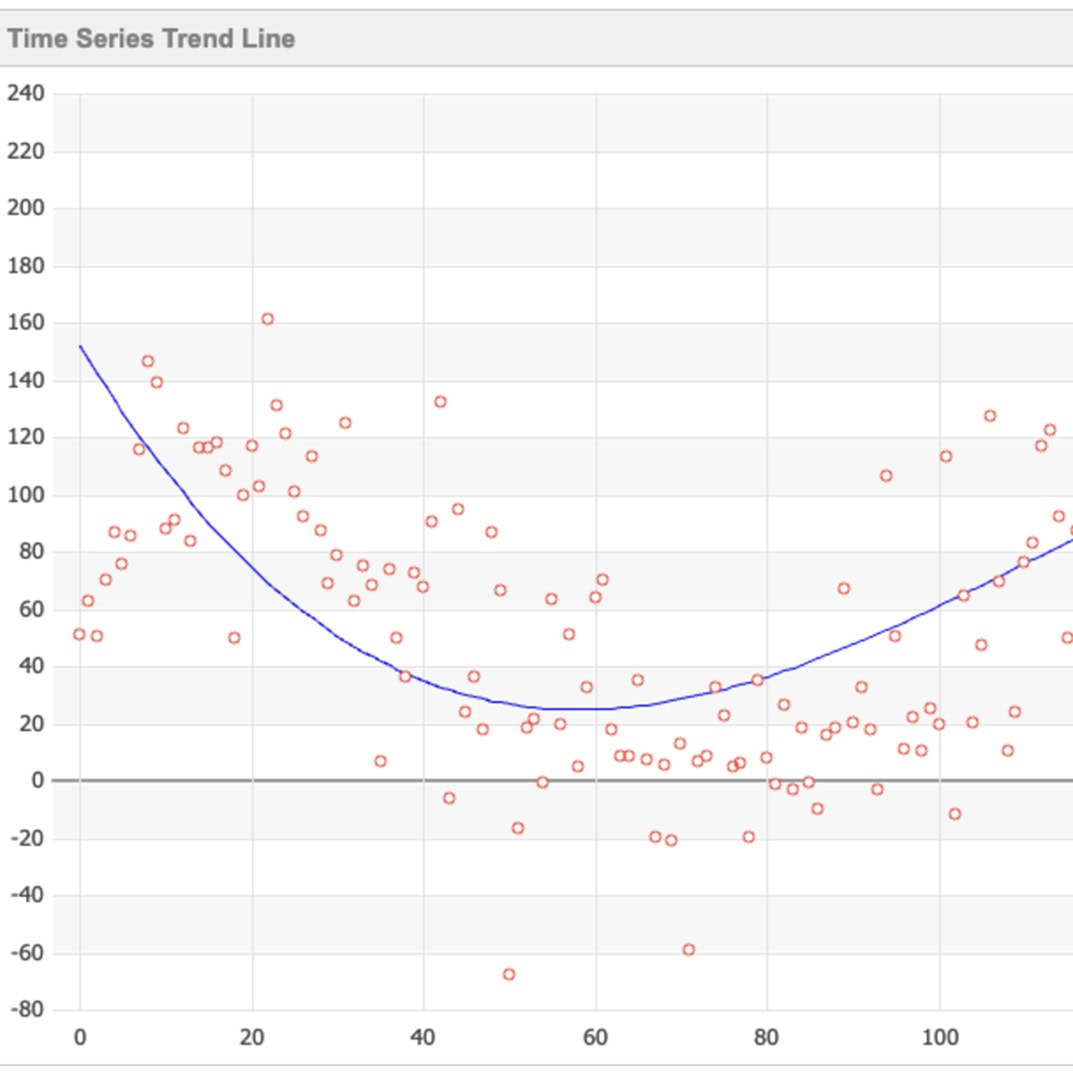
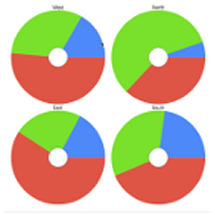
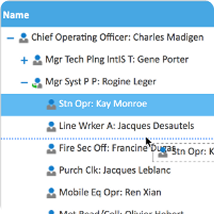
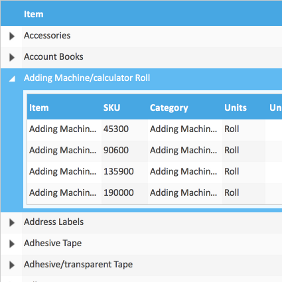
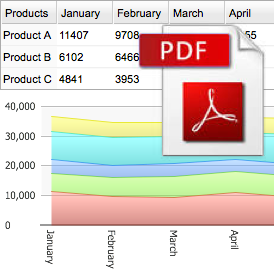
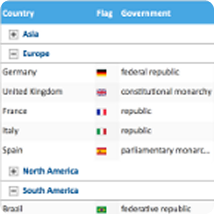
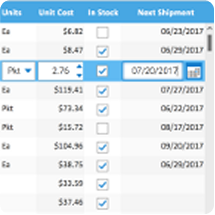
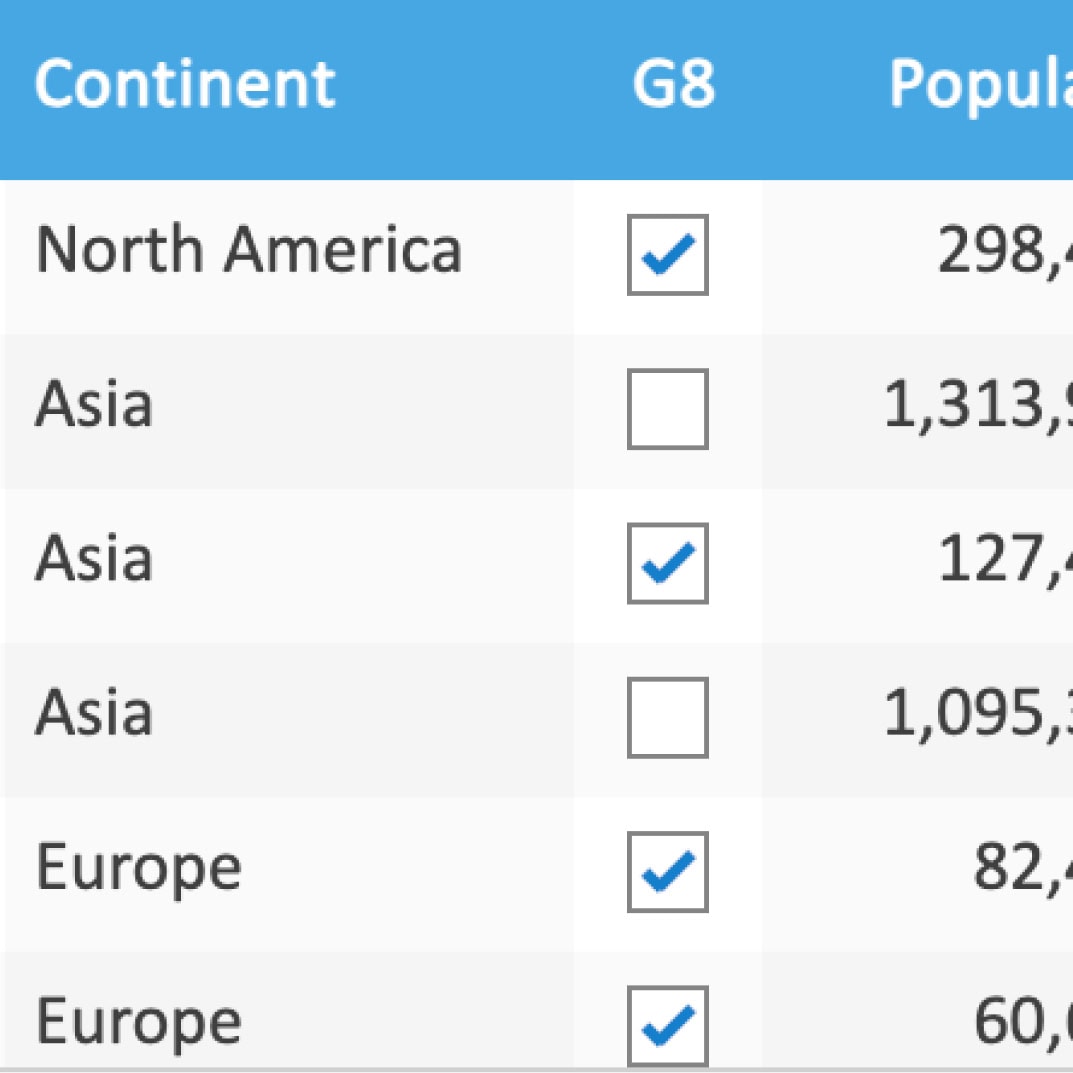
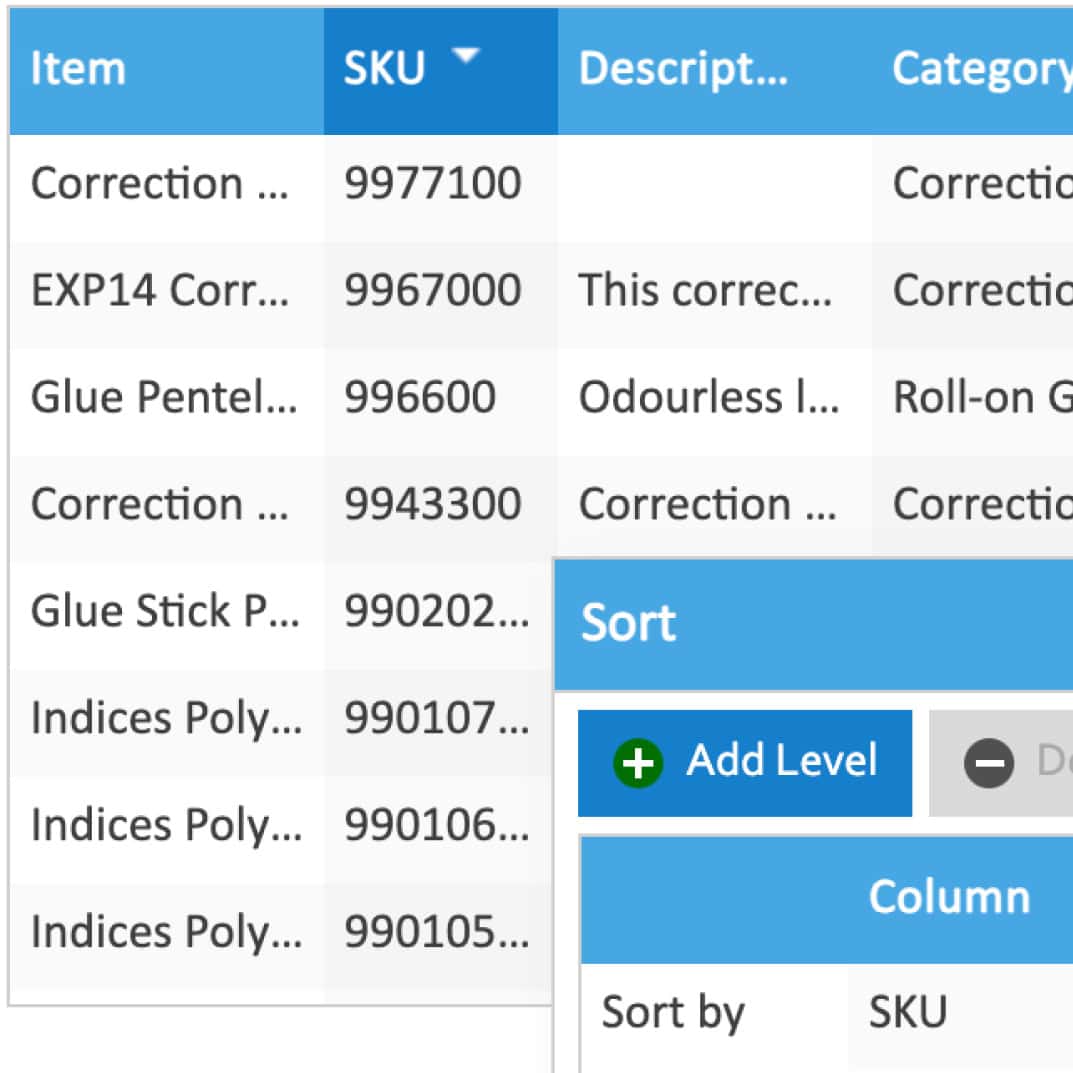
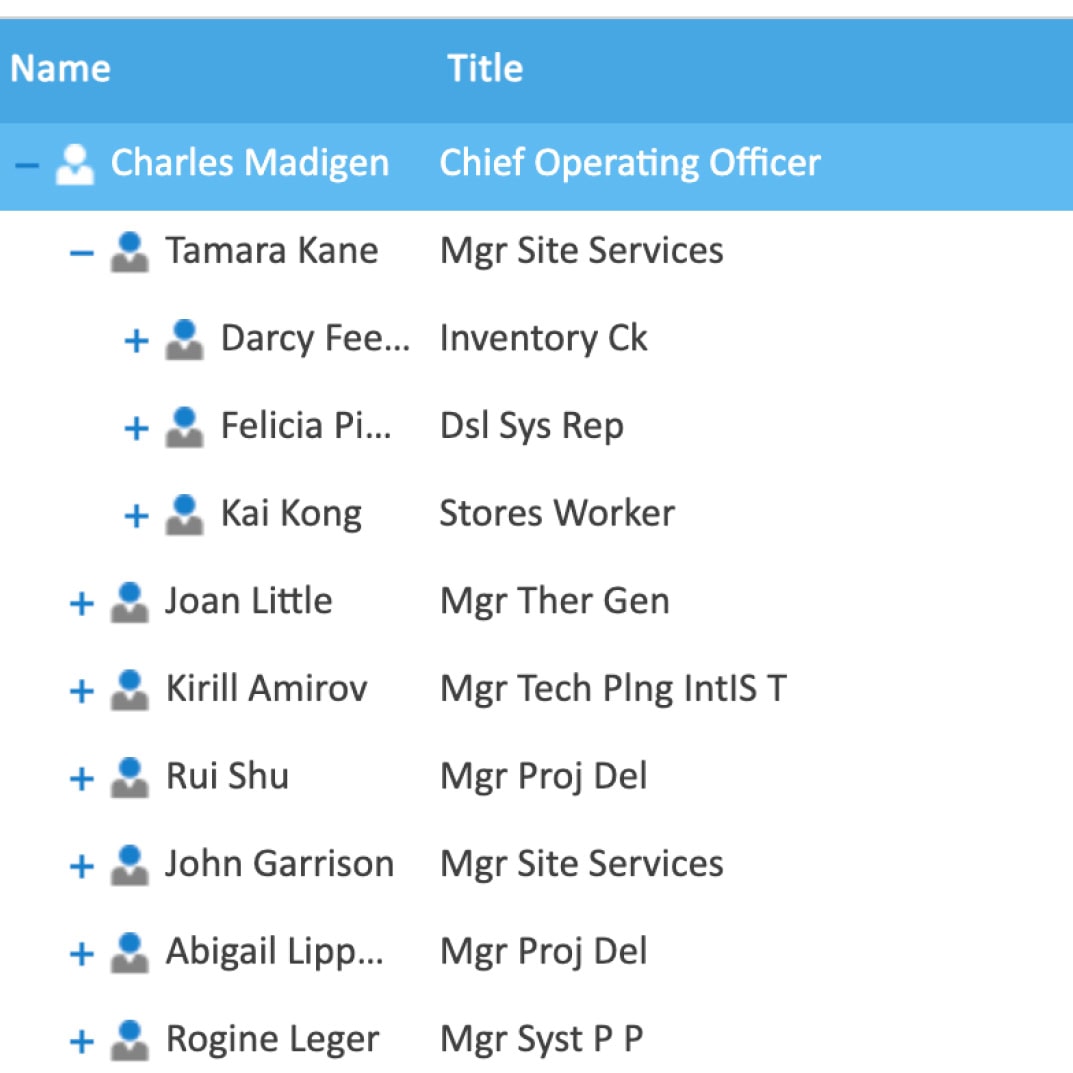
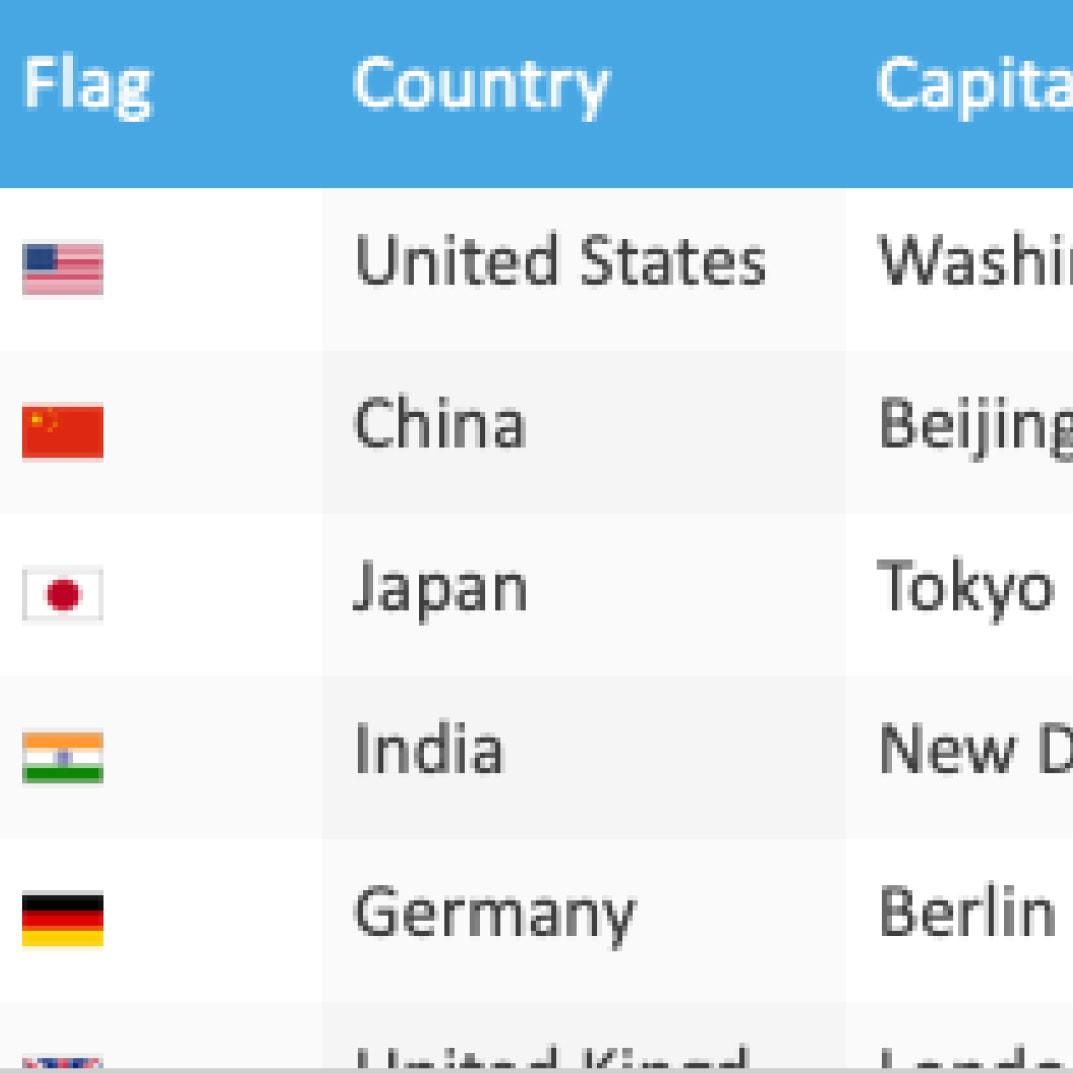
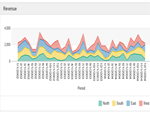
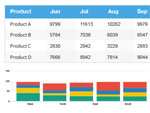
SmartClient delivers the broadest and deepest set of UI components available for Vue. Click any component below to see a live sample, or see the full SmartClient Showcase.
SmartClient delivers so much more
than UI Components
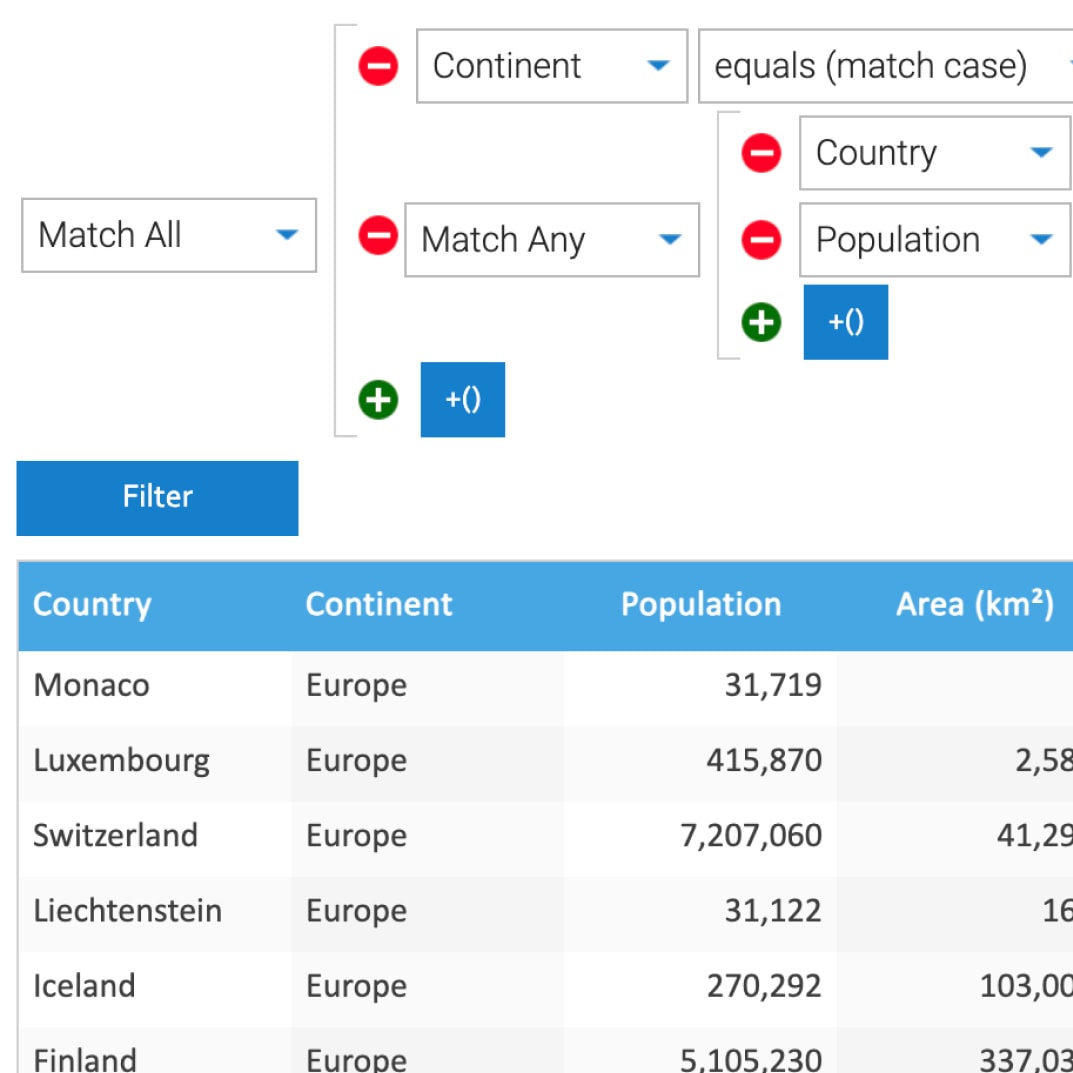
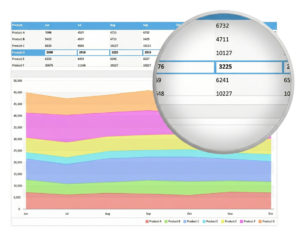
SmartClient components are awesome, but really just the tip of the iceberg. For example, SmartClient’s deep server integration and data binding capabilities bring not only faster development and maintenance, but even more powerful features such as nested filtering.
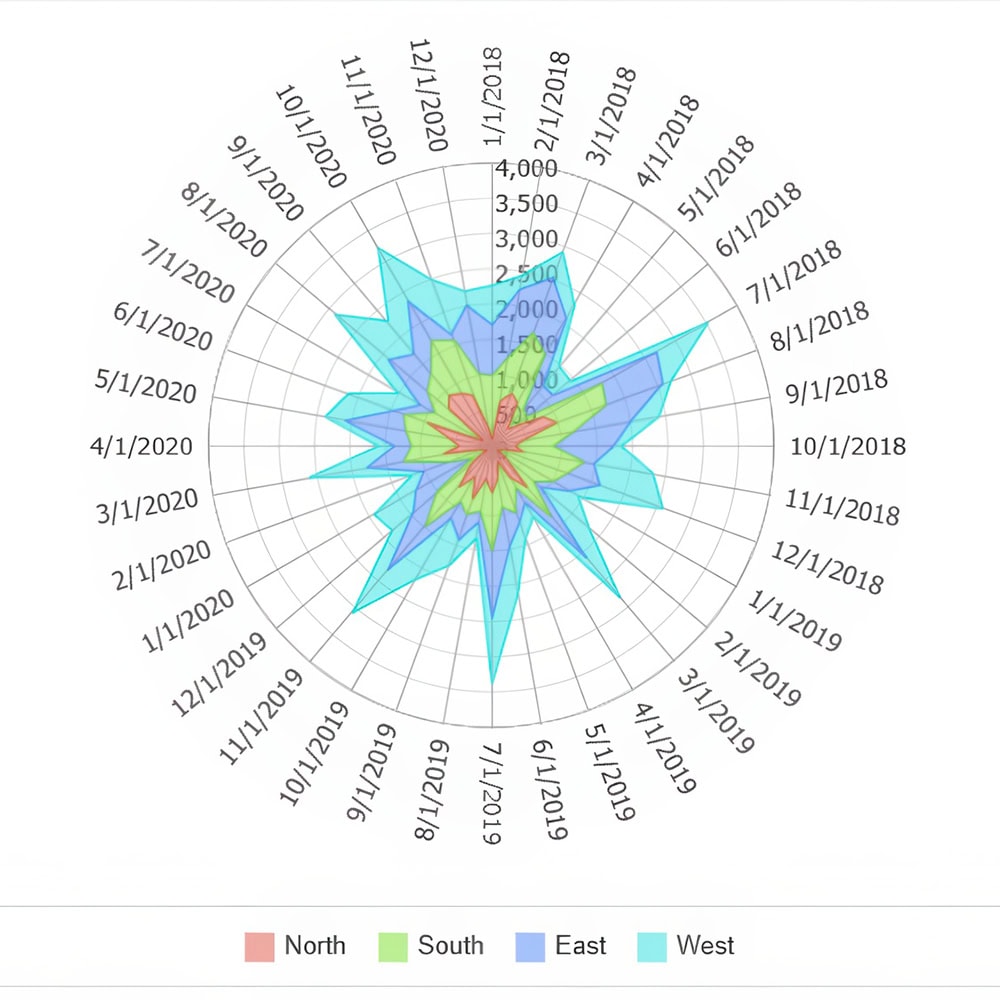
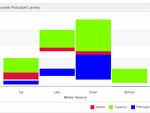
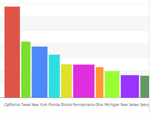
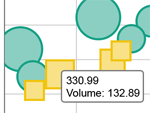
Add any Chart component into your Vue Application.
(Click any chart to see a live, interactive sample in our showcase)
Simple Chart
Multi-Series Chart
Grid Charting
Dynamic Data
Dual Axis
Multi-Series
3+ Axes
Mixed Plots
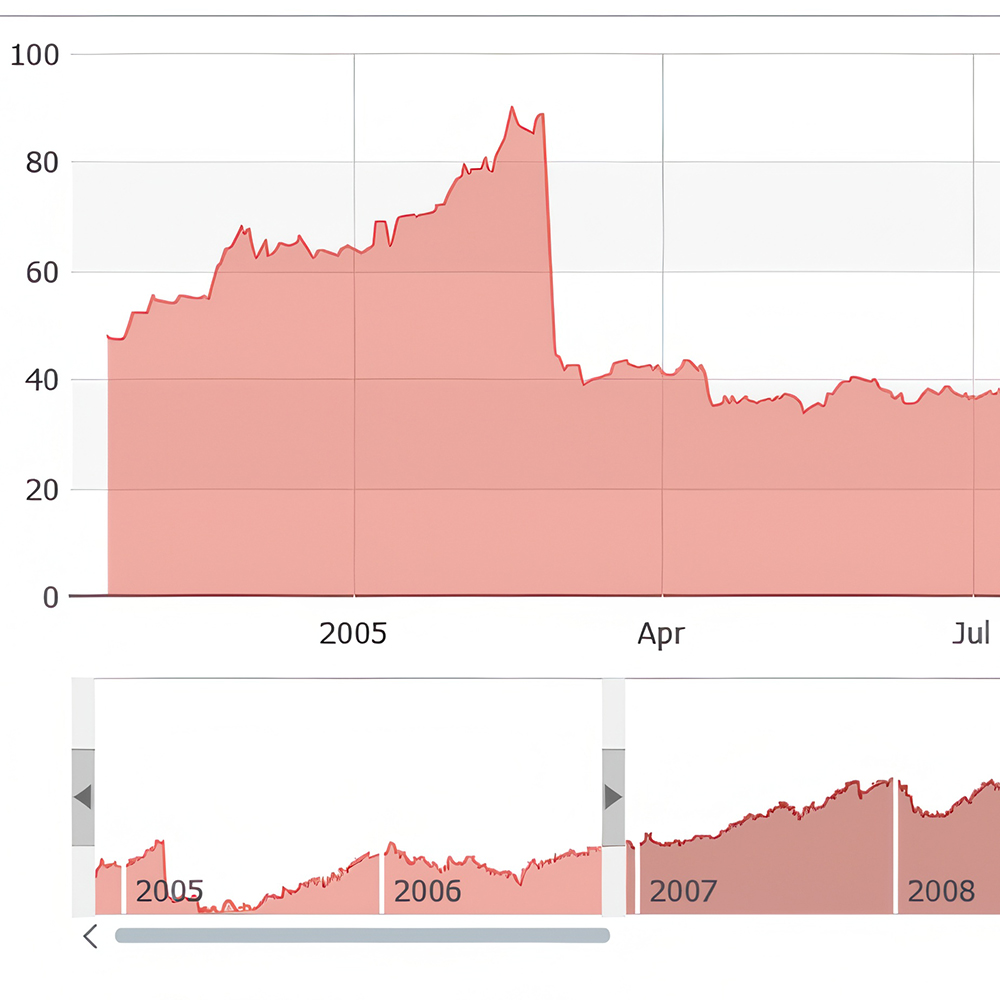
Stock Prices
Measurement Data
City Populations
Histogram Chart
Scrolling Chart
Custom Date Ticks
Scatter Plot
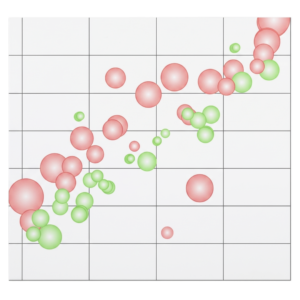
Bubble Plot
Color Scale Chart
Curve Fitting
Mean & Deviation
Error Bars
Drill Up/Down
CubeGrid Charting
Log Scaling
Interactive Data Points
Adding Elements
Chart Image Export
Chart PDF Export
Drawing Export
Custom Hovers
Course Description
Introduction to Smart GWT
This 3 days course provides a thorough introduction to using Smart GWT. The course outline is shown directly below. For a detailed agenda, click the View Smart GWT Detailed Agenda link underneath.
“The training was excellent… we were in awe of Paul’s technical ability, he just seems to know everything.”
- Northrup Grumman
The “Intro to Smart GWT” is held from 9am-5pm PST on 3 days: Thursday 13th, Friday 14th and Monday 17th. Although this schedule may best accommodate US participants, we welcome attendees from all timezones. The schedule includes no-class days to allowing personal time to try out what you have learned, and be able to ask more informed questions on the final day.
Course Description
Introduction to SmartClient
This 3 days course provides a thorough introduction to using SmartClient. The course outline is shown directly below. For a detailed agenda, click the View SmartClient Detailed Agenda link underneath.
“The training was excellent… we were in awe of Paul’s technical ability, he just seems to know everything.”
- Northrup Grumman
The “Intro to SmartClient” is held from 9am-5pm PST on 3 days: Thursday 16th, Friday 17th and Monday 20th. Although this schedule may best accommodate US participants, we welcome attendees from all timezones. The schedule includes no-class days to allowing personal time to try out what you have learned, and be able to ask more informed questions on the final day.
Course Description
Introduction to Smart GWT
This 3 days course provides a thorough introduction to using Smart GWT. The course outline is shown directly below. For a detailed agenda, click the View Smart GWT Detailed Agenda link underneath.
“The training was excellent… we were in awe of Paul’s technical ability, he just seems to know everything.”
- Northrup Grumman
The “Intro to Smart GWT” is held from 9am-5pm PST on 3 days: Thursday 18th, Friday 19th and Monday 22nd. Although this schedule may best accommodate US participants, we welcome attendees from all timezones. The schedule includes no-class days to allowing personal time to try out what you have learned, and be able to ask more informed questions on the final day.
Course Description
Introduction to SmartClient
This 3 days course provides a thorough introduction to using SmartClient. The course outline is shown directly below. For a detailed agenda, click the View SmartClient Detailed Agenda link underneath.
“The training was excellent… we were in awe of Paul’s technical ability, he just seems to know everything.”
- Northrup Grumman
The “Intro to SmartClient” is held from 9am-5pm PST on 3 days: Thursday 14th, Friday 15th and Monday 18th. Although this schedule may best accommodate US participants, we welcome attendees from all timezones. The schedule includes no-class days to allowing personal time to try out what you have learned, and be able to ask more informed questions on the final day.